|
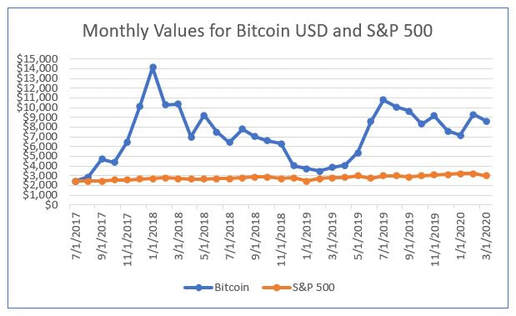
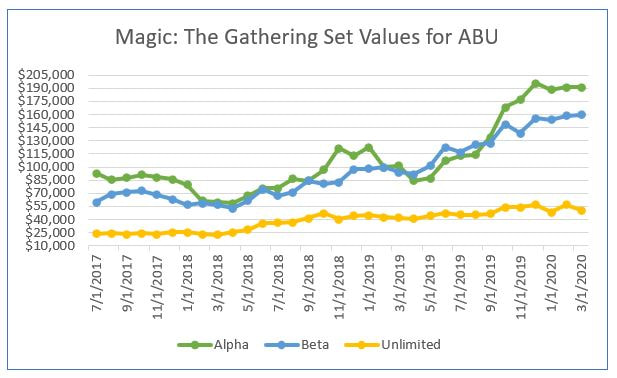
Magic: The Gathering is a trading card game that began in 1993. The releases of Alpha, Beta, and Unlimited (ABU) card sets created the foundations for a game that has lasted over 25 years. Many cards in these first few sets are sought after by collectors and players. One MTG card has sold for over $100,000. Individuals do not just buy cards to collect and play, they also purchase cards as an investment vehicle. Other alternative investments that people participate in are cars, artwork, and Bitcoin. The rising price of Bitcoin in 2017 to almost $20,000 captured the world’s attention. Early investors reaped huge returns upon selling near Bitcoin’s high. There were stories of people that spent their new wealth from Bitcoin on collectibles like MTG. In particular, Reddit users in the r/mtgfinance subreddit shared information on buying and selling Bitcoin for MTG cards. As information spread on Bitcoin being used to buy MTG cards, it was perceived that prices for MTG’s most valuable cards were affected by cryptocurrency. In order to better understand the magnitude Bitcoin had on the price of MTG’s first three sets, I ran a regression analysis. For those unfamiliar with regression, you can find some basic information here. I recommend watching the video in the link for a better understanding of regression output. This analysis attempts to comprehend the relationship between Bitcoin and ABU from July 2017 to March 2019. I used the Bitcoin USD (BTC-USD) for historical Bitcoin prices. The S&P 500 was added to see if a relationship existed between ABU as well. I pulled pricing history from Yahoo Finance and MTGGoldfish. Data used in this analysis can be found here. The first two worksheets in the data file contain historical data. The remaining worksheets contain regressions. Establishing the Null Hypothesis In this analysis, I attempt to find statistically significant relationships between Bitcoin, S&P 500, and ABU. This analysis uses the ANOVA method to test significance. The null hypothesis for this analysis is that no statistically significant relationship exists between variables. The F-value must be larger than the Significance F (also the P-value) to reject the null hypothesis. In addition, I used an alpha level (significance level) of 0.05. If the P-value is less than or equal to 0.05 (or 95% confidence), the null hypothesis can be rejected. The F-value and P-value must pass each hypothesis test to fully reject the null hypothesis. To explain variability of the data, I am looking for an R-squared value close to 100. In addition, the Pearson correlation coefficient was calculated at the top of each linear regression worksheet. In the linear regressions analyzed, the Pearson correlation coefficient matches the value of Multiple R. I tried to avoid overfitting by using 33 observations. Analyzing Bitcoin on S&P 500 Before diving into MTG sets, I wanted to analyze the potential relationship between Bitcoin and the S&P 500. Bitcoin historical data includes the time period it hit peak pricing at the end of 2017. The data shows large price fluctuations for Bitcoin over time. This price movement is much more erratic than the S&P 500. The image above includes a basic comparison of the historical price curves. Regression results for Bitcoin on the S&P 500 display an R Square of 0.165 and a Multiple R of 0.405. The regression is saying that 16.5% of the Bitcoin variability can be explained by the S&P 500. The F-value of 6.12 is larger than Significance F of 0.019. Finally, the P-value is less than 0.05 at 0.019. Since the F-value and P-value passed the significance level tests, the null hypothesis can be rejected. Alpha, Beta, and Unlimited The above graph illustrates price trends over time for ABU. Visually, Alpha and Beta follow similar price movement. A regression analysis of Alpha on Beta is available in the data file. The results showed statistical significance between Alpha and Beta. Even though Unlimited has a different value level than Alpha and Beta, it does have a similar price curve. The regression analyses for Unlimited on Alpha and Unlimited on Beta also showed statistical significance.
Alpha Analysis The regression for Alpha on Bitcoin produced interesting results. When looking at the Bitcoin related regression, the F-value is larger than Significance F. Unfortunately, the P-value of 0.55 is not less than or equal to 0.05. Note also that the R Square value is only 0.011. The null hypothesis cannot be rejected for the Alpha on Bitcoin regression. When looking at the regression for Alpha on S&P 500, the null hypothesis can be rejected. The F-value of 28.90 is larger than Significance F. The P-value is lower than 0.05. In addition, R Square is 0.482. Almost half of the variance can be explained. Beta Analysis The Beta on Bitcoin regression produced similar results to Alpha on Bitcoin. When looking at the Bitcoin related regression, the F-value is slightly larger than Significance F. The P-value of 0.42 is not less than or equal to 0.05. In addition, the R Square value is only 0.021. The null hypothesis cannot be rejected for the Alpha on Bitcoin regression. For the regression of Beta on S&P 500, the null hypothesis can be rejected. The F-value of 51.25 is larger than Significance F. The P-value is lower than 0.05 and the R Square is 0.623. Over half of the variance can be explained. Unlimited Analysis The results of Unlimited on Bitcoin cannot reject the null hypothesis. While the F-value for Alpha and Beta on Bitcoin was higher than Significance F, it was lower for Unlimited. The P-value of 0.657 is not less than or equal to 0.05. Surprisingly, the R Square value was under 0.01 at 0.006. Regarding the regression of Unlimited on S&P 500, the null hypothesis can be rejected. The F-value of 53.18 is larger than Significance F. The P-value is lower than 0.05 and the R Square is 0.632. Over half of the variance can be explained. Summation In all three regressions for ABU on Bitcoin, the null hypothesis cannot be rejected. This means that the results showed no significant relationships between ABU and Bitcoin. However, the null hypothesis can be rejected for all regressions regarding ABU and S&P 500. The highest statistical significance shown was Unlimited on S&P 500 followed by Beta on S&P 500. Multiple regression analyses for Bitcoin on ABU and S&P 500 on ABU are available in the data file. Their results were comparable to the single variable regressions. What the analyses show is that Bitcoin may not have a strong relationship with ABU prices. Additionally, the S&P 500 is statistically significant with ABU sets. The results of these analyses do not disprove that Bitcoin affects MTG card prices for ABU. It is important to remember that correlation does not imply causation. Unfortunately, these models suffer from a few issues regarding regression data. The r/mtgfinance subreddit community shared feedback with issues regarding autocorrelation, time series issues, and large residuals. In addition, the values could be standardized with z-scoring. One possible solution is limiting the time frame the model captures by using values on a daily or weekly basis rather than monthly. The anecdotal evidence points to people buying ABU cards with Bitcoin near Bitcoin's peak price. It was suggested measure data between late 2017 and early 2018. While the data has flaws, the idea of measuring Bitcoin and ABU pricing is worth exploring further (Updated March 30th, 2020). *The information in this article is of my own knowledge and opinion. It is meant for informational purposes only. I am not a registered financial professional or trying to act as one.* Comments are closed.
|
Follow me
on Instagram @card_knock_life Categories
All
Archives
July 2024
This website contains affiliate links
|


 RSS Feed
